Showing posts with label Missouri. Show all posts

Friday, January 23, 2026

Weekend Storm: Snow Numbers

A significant winter storm is still in the cards for Missouri, Illinois, Kentucky, and Indiana.  If you have plans to travel, you should read this and then reconsider your plans.

Dry air is currently infiltrating the central United States following a passing cold front.  Dew points have dropped below zero, hinting at the arctic origins of the air.

It will take a small amount of time to saturate the atmospheric column, but it should not take long for precipitation to reach the ground as snow.

TIMING:

  • Missouri: Snow will start to enter southeast Missouri from the southwest Saturday morning.
  • Illinois: Snow will enter Illinois late Saturday morning/early afternoon.
  • Kentucky: Snow will enter the extreme southwest corner of Kentucky Saturday mid-morning.
  • Indiana: Snow will enter the southwest corner of the state Saturday afternoon.  It should enter central Indiana late Saturday afternoon.

HOW MUCH:

Computer models have been extremely consistent on how much water will be available in the atmosphere.  There is one computer model that has been consistent with lower water amounts - the GFS.

All that being said, there is copious amounts of water available and there will also be cold air in place.  Snow to Liquid ratios will be higher than normal due to the cold.  Normally, we look at 10 to 1.  For this storm, the ratio could range from 12 to 1 to as much as 18 to 1.

After looking over the Friday morning computer model runs (and the last several days worth of data) these are the numbers I think could fall as snow through Sunday night.

INDIANA 

  • Bloomington: 8"-12"
  • Columbus: 10"-14"
  • Indianapolis: 7"-10"
  • Shelbyville: 8"-11"

MISSOURI

  • Cape Girardeau: 8"-11"
  • St. Louis: 7"-11"

ILLINOIS

  • Carbondale: 10"-15"

KENTUCKY

  • Paducah: 7"-12"

These numbers could still fluctuate as more data comes in over the next 24 hours.  If there is any sleet mixed in, especially in western Kentucky and the Missouri bootheel, it could have significant impact to snowfall amounts.

The attached map may not exactly match what I have forecast above.  It is a display of a blend of computer model snowfall through 7am ET Monday.

Thursday, January 22, 2026

Winter Storm Update

I have been monitoring data coming in from Wednesday night's and Thursday morning's computer model runs and it still looks like a winter storm will have a significant impact on the Ohio River Valley.

The upper-level energy for the storm is still located off the southwest coast of California.  It will be better once it is overland and models can get a better sampling of what is happening in atmosphere.  That being said, the NOAA Hurricane Hunters - the pilots and scientists that fly in to hurricanes to collect data - started to fly missions in to the storm over the Pacific earlier this week.  Another mission is scheduled for Thursday evening.  I can't emphasize enough how important is that they collect.  The data goes straight in to the computer models we use to forecast weather.

In Wednesday's update I talked about how much water there will be to work with over the region.  Wednesday night's computer model runs, and Thursday morning's, increased the projected water available.

A 34-computer model average suggests the following liquid equivalent 7am ET Saturday - 7am ET Monday along with the range in data.

INDIANA 

  • Bloomington: 0.82" (0.58" - 1.02")
  • Columbus: 0.86" (0.61" - 1.05")
  • Indianapolis: 0.67" (0.47" - 0.86")
  • Shelbyville: 0.76" (0.58" - 0.91"

MISSOURI

  • Cape Girardeau: 1.01" (0.82" - 1.22")
  • St. Louis: 0.63" (0.43" - 0.83")

ILLINOIS

  • Carbondale: 0.91" (0.70 - 1.10"

KENTUCKY

  • Paducah: 1.16 (0.88" - 1.55")

Needless to say, that is a LOT of water for a winter storm.  Especially when most locations - north of the Ohio River - will be mainly all snow.

Having enough cold air to create snow will not be a problem with this storm.  (There will be some, mainly along and south of the Ohio River, that may have a little bit of warm air in the atmospheric column which would create sleet, at times.)

Air will be cold enough for higher than normal snow to liquid ratios.  A good rule of thumb is for a 10 to 1 (10:1) ratio.  With the cold air expected to be in place, ratios could go from 12:1 to as much as 18:1.  

This is when the fun begins.  You - or your kids that know how to multiply - can start doing the math on how much snow that could potentially produce.  Multiply the water amount to the snow to liquid ratio.  Example:  0.86 x 14 = 12.0"

Areas that have sleet mixed in will drastically reduce the numbers.  Sometimes by as much as 40%+.

There is a little more massaging of the data that goes in to producing the snow forecast, but this can give you a rough idea.

If the models don't come in overnight/tomorrow suggesting much lower water amounts, this will likely be a "doozy" of a winter storm for many in Missouri, Illinois, Indiana, and Kentucky.  And that isn't talking about the BIG ice storm that will happen further south.

Let's see what Friday's information brings and that could warrant me issuing Freak-Out-Meters for several locations in Missouri, Illinois, Kentucky, and Indiana.  Stay tuned...

Wednesday, January 21, 2026

Weekend Winter Storm to have big impacts on Central United States

Chatter about a winter storm for the upcoming weekend is in full throat on the inter-webs.  I am just starting to dig in to the data and see what might be coming.

The good news... For most of the people that follow me on here - Missouri, Illinois, Indiana - the thermal profile of the atmosphere suggests this looks to be mainly a snow event, at the moment.  (This does not mean there could not be sleet involved for some.)  It looks to start in eastern Missouri pre-dawn Saturday and exit Indiana Sunday night.

Everyone wants to know how much.  Yes, people are throwing out numbers, but that is all it is at this moment.  Numbers.  To be honest, it is too early to talk specific snow amounts, snow no you will not see me giving snowfall amounts yet.  However, I will show you how much liquid precipitation computer models are suggesting for a few locales.

A 32-computer model average for 7am ET Saturday through 7 am ET Monday:

INDIANA

  • Bloomington: 0.47"
  • Columbus: 0.48"
  • Indianapolis: 0.36"
  • Shelbyville: 0.42"

MISSOURI

  • Cape Girardeau: 0.79"
  • St. Louis: 0.41"

ILLINOIS:

  • Carbondale: 0.66"

Yes, at this distance it appears this storm has a hefty supply of water.

We can also look at ensemble computer models.  Instead of a single forecast run, an ensemble uses multiple model runs (often 20–50+).  Each run starts with slightly different initial conditions (temperature, pressure, wind, moisture).  The ensembles can give us a range of how things could happen.

Today, I want to show you how many members of five global ensemble models suggest there will be measurable snow on the ground Sunday evening.

Columbus, IN: 94% - 170 out of 180 members
Indianapolis, IN: 94% - 170 out of 180 members
St. Louis, MO: 94% - 170 out of 180 members

It does make me chuckle that out of 180 members, all three locations have identical numbers.

We know it will be cold, which will allow for some of the snow to be fluffed up, resulting in a higher snow to water ratio.


Winter Storm Watches have been hoisted from New Mexico to North Carolina.  As more data comes in, the forecast will be refined and the picture will become more clear.  As it becomes more clear, we will have a better idea for snow totals and impacts.  I suspect a Freak-Out-Meter will be issued before the weekend gets here.

BOTTOM LINE:  This will be a good weekend to stay indoors and watch the storm through the window.

What are you hoping for from the storm?

Wednesday, April 3, 2024

How to build your own observatory to watch the solar eclipse

Solar eclipse sunglasses are becoming a hot commodity as we get closer to August 21. If you are not able to find a pair of the special glasses, you can still watch the eclipse with your own eyes. How? Build your own solar observatory with a few household items. Plus, it is perfectly safe for your eyes!

Kids, ask your parents for help building this observatory!


WHAT YOU NEED:

  • Shoe box
  • 1 piece of white paper (can be a half sheet)
  • Utility knife or X-Acto blade
  • Tape
  • Pin or paperclip
  • Small piece of aluminum foil


HOW TO ASSEMBLE

1. Cut a square hole approximately 1″ by 1″ in the lower right small end of the shoe box using the utility knife.

Hint: If the shoe box has a cut-out in the lid, cut the 1″x1″ hole at the other end of the box.

2. Cut a piece of aluminum foil that is slightly larger than the 1″x1″ hole from step 1. Place the piece of aluminum foil over the hole and tape it to the box. Be sure to only place tape on the outside edges of the foil.

3. Use the pin or paper clip and gently make a pin hole in the center of the aluminum foil. The hole is where the sun will shine through.

Hint: If you are using a piece of thin aluminum foil, before taping the foil to the box place the it on a table top. Gently press the pin or paperclip against the foil until a small hole is made. Then tape it to the box. If the foil tears while poking a hole in it (similar to what you see in the picture), you can fix it by taking another piece of foil, put a small hole in it, then tape the second piece over the first piece making sure to line up the holes so light can shine through.

4. Tape the white paper to the inside of the box directly across from the square of aluminum foil with the pinhole. The piece of paper will act as a movie screen for your observer. This is where the sun’s image will appear.

5. Using the utility knife, cut another 1″x1″ hole in the lower right corner of the long side of the box. This will be the hole you look through. You will be able to see the white paper you taped to the inside of the box through this hole.

6. Stand with your back to the sun, close the lid and look through the open square on to the white paper. Adjust the box so you can see the sunlight through the pinhole and on the white paper.

You will see a small image of the sun projected on the white paper.


Sunday, February 2, 2014

Starting February with Snow & Ice

There has been a lot of talk in the one to two weeks about a colossal storm heading for the Midwest this week.  A lot of the talk and hype has been extremely irresponsible, but that is a discussion for a different day.  It does appear a storm will impact the Midwest Tuesday and Wednesday.

One of the reasons I have been relatively quiet about the storm and its potential is due to the many different solutions computer models were coming up with.  Some had it as a HUGE ice storm, others as a HUGE snow storm and most had it somewhere in between.

Patience is a virtue sometimes when it comes to weather forecasting.  Let the models battle it out for a while and then start to come up with a somewhat unified solution to what the storm could do.

This is a storm that is going to develop over far southern New Mexico, western Texas and northern Mexico.  As it matures, moisture will become plentiful as it taps in to the Gulf of Mexico Tuesday.

Here is a solution the latest run of NOAA's Global Forecast model has come up with.  The image depicts 6pm CT Tuesday.
0z GFS - 6pm CT Tuesday
(Click image to see larger version.)
This is a classic winter storm for the Midwest.  The surface center of low pressure is tracking from around Monroe, Louisiana to just south of Nashville, Tennessee by Tuesday evening.  We're talking snow along and north of I-44 in Missouri and roughly along I-70 in Illinois.  This also means the rain/snow line is at play for southeast Missouri, southern Illinois and western Kentucky.

At this time, I do think all forms of winter precipitation will be possible for southeast Missouri, extreme southern Illinois and western Kentucky.  The primary nuisance will be rain, freezing rain and sleet.  There will probably be a change over to a little snow towards the end of the event.  The exact location of the rain/snow line is a little difficult to pinpoint this far out.  As you often hear meteorologists say, "The track of the storm will be extremely important." and this will be the case this time.  A change in just 40-miles will have a huge impact on what type of precipitation falls.

Right now, for places like Cape Girardeau, Paducah, and Poplar Bluff, I think rain, freezing rain and sleet will be the primary types of precipitation.  Icing could potentially be a concern, but let me say right now... This is NOT anything like the ice storm of 2009.  NO WHERE CLOSE.

TALKING SNOW

Let's talk a little snow for the Midwest.  I have gone through and looked at several computer model runs and have come up with a snow matrix.  Looking at the matrix can give you an idea of the range computer models are suggesting could happen through Wednesday night.  The data includes tonight's runs of the NAM and GFS and also Sunday morning's run of the European forecast agency's computer model as well as the 23-member SREF ensemble.
Missouri/Illinois Snow Matrix
(Click image to see larger version.)

Indiana Snow Matrix
(Click image to see larger version.)

Colorado Snow Matrix
(Click image to see larger version.)
As you can see, there is some variation between the computer models, but I must say, they are coming in to line with each other.

For many, the storm is still out 36 to 48 hours but I'll go ahead and throw out some ball park numbers.  I hope to update my blog tomorrow evening (time permitting) with fine tuned numbers.  Although, if you have followed my blog for a while, you know that my initially numbers usually only get slightly tweaked.  Think of it as a very time course correction.  But do know, these numbers can adjust as we get closer to the event.

COLORADO: (Monday night through Wednesday afternoon)
  • Colorado Springs:  3"-5"
  • Lamar:  5"-9"
  • Pueblo:  2"-4"
  • Springfield:  4"-6"
ILLINOIS: (Tuesday through Wednesday night)
  • Mt. Vernon:  2"-5"
INDIANA: (Tuesday through Wednesday night)
  • Columbus:  4"-8"
  • Indianapolis:  6"-8"
  • Lafayette:  5"-9"
MISSOURI: (Tuesday through Wednesday night)
  • Cape Girardeau:  Up to 1"
  • Poplar Bluff:  Up to 2"
  • St. Louis:  3"-5"
FREAK-OUT-METER

COLORADO:
  • Colorado Springs: 2
  • Lamar: 5
  • Pueblo: 2
  • Springfield: 4
ILLINOIS:
  • Mt. Vernon: 5
INDIANA:
  • Columbus: 5
  • Indianapolis: 5
  • Lafayette: 5
MISSOURI:
  • Cape Girardeau: 4
  • Poplar Bluff: 4
  • St. Louis: 3
For those that don't know what my Freak Out Meter is, it is a number I give out that attempts to quantify how big of a deal the upcoming weather event will be. It is based on a 0-10 scale. Zero being the lowest, "not a deal at all", and 10 being "get all the bread, milk and eggs and lock yourself in the basement". The score is 100% subjective and it's an attempt to have a little fun.

For more frequent updates, be sure to follow me on Twitter at @johndissauer.

Sunday, December 1, 2013

End of Week Winter Storm

Things could start getting active this week in the winter weather department.  Bitterly cold air will be on the move from Alaska/Canada and moisture could be coming north through the Mississippi River/Ohio River valleys.

Before I get too far in to this I want to remind you that the items I am going to discuss are still MANY days away.  Things can and likely will change in the forecast.  The data I am going to show you is not the actual forecast but instead a weather computer model projection of what could happen.

Ok, now that all of that is out of the way lets talk about later this week, specifically in Missouri, Illinois, Kentucky and Indiana.

One basic concept we need to discuss before going any further.  Cold air is denser/heavier than warm air.  Hence, hot air balloons rise.

All computer forecast data is indicating COLD air will be on the move through the central United States late Wednesday and Thursday.
Projected Surface Temperature - 6am CT Thursday
(Click image to see larger version.)
The cold front will be somewhere near the Ohio River by Thursday morning.  Again, keep in mind that cold air sinks, so the cold air will undercut warmer air, which will reside a few thousand feet in the sky.

Temperatures at the surface will be dropping and it will be cold at the end of the week and cold for the weekend.  Here is a look at forecast temperatures from the European forecast agency's computer model for Friday afternoon.
Projected Surface Temperature - 12pm CT Friday
(Click image to see larger version.)
Computer models also project a couple waves of energy riding up and over the cold front.  The moisture will be riding in the warmer layer above the ground.  As the moisture falls it will encounter the below freezing air.  Depending on how thick the layer of warm layer and cold layer is will determine what type of precipitation it could be.  In other words, we could be talking a cold rain, freezing rain, sleet and/or snow.

At this point, it is too difficult to say with any certainty the form will be.  We are talking about trying to determine the temperature in a layer of air along with how thick the layer will be (A few hundred feet or thousands of feet?) for something that is 96-120 hours away.  That being said, at this time, I think there potential for snow and/or freezing rain.

What could make this interesting is there could be a couple waves of moisture and there could be ample moisture to work with.

Here is a look at the National Weather Service’s Global Forecast model, the GFS, using a program called BUFKIT.  Specifically, the data is for Cape Girardeau.  Keep in mind when looking at the data, the timeline runs from right to left.
12z Sunday GFS for Cape Girardeau
(Click the image for larger version.)
The colored bars indicate what the program is projecting what form the moisture will fall.  Green = rain | Orange = sleet | Red = freezing rain | Blue = snow.  See all the green and blue?  Right, neither do I.  It is showing up as red.  That means the software/computer model is suggesting it could be falling in the form of freezing rain.

I mentioned "ample moisture".  The GFS is projecting 0.4" to 0.8" of liquid Thursday through early Friday morning for much of southeast Missouri, southern Illinois and western Kentucky.  The European computer model is also putting down some decent moisture (0.5" to 0.8") for the same areas through Friday afternoon.  The one difference is the European model is suggesting it would fall as snow, especially north of the Missouri bootheel and western Kentucky

Also to note, there are hints of another round of moisture coming up through the area Sunday in to Monday.

At this point this is nothing to get concerned over.  My "Freak-Out-Meter" is at maybe a 2 out of 10.  However, I point out the possibilities for later in the week to try and get you to pay attention to the forecast over the coming days.  As more data becomes available, as the computer models are able to sample more of the atmosphere, we will start to get a better idea of what may happen.  As I like to say... Stay tuned.

Bottom line... It is going to turn much colder for the end of the week and the weekend.  There is potential for rain, snow, and freezing rain.

Saturday, November 16, 2013

Severe Storms Sunday

The threat for severe weather Sunday continues for parts of the Mississippi River Valley and the Ohio River Valley.

The Storm Prediction Center has placed parts of Illinois, Indiana, Kentucky, Michigan and Ohio in a "Moderate Risk" for severe storms.  They have also placed parts of Arkansas, Illinois, Iowa, Kentucky, Missouri and Tennessee in a "Slight Risk".  The outlook covers the time from 7am ET Sunday through 7am ET Monday.

The population bases within the different risks are pretty high.  Seventy-six and a half million people live within the risk area.  A little over 39-million people live within the "Moderate Risk" and another 37-million live within the "Slight Risk".

Hopefully, people aren't taken by surprise with the potential for severe weather.  November is not an unusual time for severe weather.  In fact, it is the height of the secondary severe weather season for Ohio River/Mississippi River Valleys.

Here is a look at the latest information from the RPM 4km high resolution computer model.

It suggests a line of storms begins to develop and quickly strengthen around 11am Sunday in northwest Illinois.  If this holds true, this could start to bring the line in to the St. Louis metro area shortly before noon.  It would also bring a line of storms near the Chicago metro area around noon.  The model also suggests the line of storms reaching central Indiana between 5pm and 8pm.

IF a line develops further south in to Missouri, the model is suggesting it could start to arrive in southeast Missouri around 12pm-1pm.  The line would continue to move east arriving at the Mississippi River (in southeast Missouri) around 2pm-3pm.

The line mentioned above is likely a secondary line that will develop ahead of a cold front.  Well ahead of the front there could be isolated to scattered thunderstorms later Saturday night through early Sunday morning (pre-dawn) in Missouri, Illinois, Indiana and Kentucky.  There is enough instability to generate a few strong thunderstorms but I think the "main show" will be the secondary line.

There appears to be plenty of instability within the atmosphere to get thunderstorms going.  Here is a look at the CAPE's (a form of instability forecasters look at) from this morning's run of the North American Model at 12pm CT.

CAPES are anywhere between 500 and 1000+ joules/kg for anywhere from Michigan down through Arkansas.

Also, if you step up to around 30,000 feet, there will be tremendous amounts of lift taking place due to divergence in the jet stream starting Sunday morning for areas west and southwest of St. Louis.  Then by late morning a powerhouse jet streak will start to nose in to central Illinois and western Indiana.  Winds will be moving along at 145mph out of the west at 30,000 feet.

Further down the atmospheric column winds will be coming out of the southwest at 55-70 mph just 5,000 feet above the ground.  This being the case, there will be lots of dynamic energy along with turning of the winds throughout the column.  Any thunderstorms that get going can start turning quickly.

I want you to note the probabilities put out by the Storm Prediction Center.

Notice the large 45% probability through the Midwest.  That doesn't mean there is a 45% chance of severe storms for that entire area, however it means that there is a 45% probability of severe weather occurring within 25 miles of any point within that area.

You may also notice the hatched area.  That indicates an area where there is a 10% or greater probability
of significant severe weather within 25 miles of a point.

So what are the main threats?  Right now, it appears that the biggest threat from thunderstorms will be strong, damaging winds.  Also, I think there is a decent tornado threat with this setup.  Especially the further north you go.  For right now, lets say north of I-64 in Illinois in to Indiana.  That means there will be a threat for tornadoes in central/northern Illinois, most of Indiana, southern Michigan and perhaps Ohio.

Since this is a time of year when people aren't thinking about severe weather, make sure you have fresh batteries in your NOAA Weather Radio.  Go over your action place with your family.  What are you going to do/where are you going to go if a Tornado Warning or a Severe Thunderstorm Warning is issued?

FREAK-OUT-METER

Finally, a lot of you ask about my "Freak-Out-Meter".  What is the meter?  It is basically a way for me to try to indicate how much I am concerned about the storm.  Hopefully, for some of you that get freaked out easily from weather it is a way to calm your nerves but also a way for you to see how big of a deal this is.  Keep in mind, this is on a scale from 0-10 with zero meaning I'm not concerned to a 10 meaning I'm beyond concerned.

Central Indiana: 6
Southern Indiana: 5
Northern Illinois: 6
Central Illinois: 5
Southern Illinois: 4
Northern Kentucky: 4
Western Kentucky: 4
Southeast Missouri: 4
St. Louis Metro: 4

Thursday, January 10, 2013

HPC Puts On Their Skates

Taking a quick glance of data this morning concerning Sunday-Monday and the possibility of freezing rain.  Last night’s European computer model (ECMWF) continues to be bullish on the potential whereas NOAA’s global forecast model (GFS) is downplaying the icing side.

One thing the models are in agreement about, rain, heavy at times, will fall Saturday night through early Sunday morning.  A cold front will be slowly moving through Missouri, Illinois and Indiana at the time.  There will be shallow cold air behind the cold front while a few thousand feet up in the atmosphere winds out of the southwest will keep temperatures above freezing.  There are two big questions at this time:
  1. How long will water be available?
  2. Where will be the location of the cold front?
Most likely, just north of the front will see freezing rain.

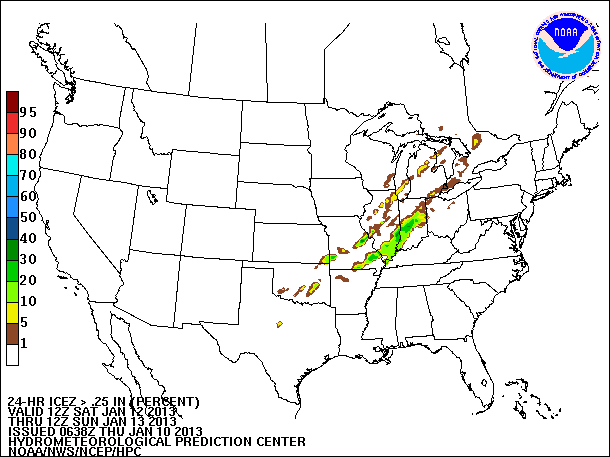
The Hydrometeorological Prediction Center is getting in on some of the freezing rain chatter.  There latest Day 3 Freezing Rain Probability Forecast and Day 3 Freezing Rain Accumulation Forecast is out and includes parts of Arkansas, Missouri, Illinois and Indiana.  The images below look at the Saturday night through Sunday morning time frame.

24-Hour Probability of Freezing Rain Accumulation 0.01”+:
Click the image to see larger version.
24-Hour Probability of Freezing Rain Accumulation 0.25”+:
Click image to see larger version.
48-Hour Freezing Rain Accumulation – 95th Percentile:
Click image to see larger version.
Notice how HPC keeps the freezing rain out of western Kentucky, southern Indiana and northeast Arkansas.  The European computer model has the freezing rain going further south in to those areas.

Will the models continue the way of the GFS, keeping the freezing rain away, or will they lean towards the Euro, hinting at an ice storm?  We’ll have to wait and see what the runs come in with over the coming days.

FREAK-OUT-METER:
  • Southeast Missouri: 3
  • Southern Illinois: 3
  • Western Kentucky: 2
  • Central Indiana: 2
  • St. Louis metro: 3

Wednesday, January 2, 2013

Snow Covers Far and Wide

Amazing what four days can do to for a winter’s snow totals.  Two storms and in some cases more than 20” of snow has fallen across parts of the Midwest.

It all started last Tuesday/Wednesday as upwards of 18” of snow fell in parts of Missouri, Illinois and Indiana.  Then Friday night/Saturday morning another couple of inches of snow fell.

According to the National Operational Hydrologic Remote Sensing Center, 76.6% of the Midwest was covered with snow this morning.

(January 2, 2013 Snow Depth - Click image to see larger version)

Compare that to a year ago when only 0.6% of the Midwest was covered.

(January 2, 2012 Snow Depth - Click image to see larger version.)

Even a person not great at math can figure out that is a HUGE increase in snow.

Nationally, as of this morning 65.8% of the continental United States was covered by snow.  Whereas last year only 18.7% was covered.

(January 2, 2012 Snow Depth - Click image to see larger version.)
For those of you that do not like snow, you will like the next 6-8 days as forecast models suggest a quiet weather pattern.  Temperatures may even moderate a little early next week but winter is far from being done.

Wednesday, December 19, 2012

12pm Weather Update - Talking Snow

Let’s get a little more in to the snow discussion.  Specifically, how much and for who.  I’ve put together a matrix of cities and various computer models’ snow output.

To begin with, here is the 12z snow accumulation projection from the high resolution RPM forecast model.  The model run covers snow through 6am CT Saturday.
(Click the image to see larger version.)

Heaviest snows will fall from southern Nebraska, central Iowa, southern Wisconsin and northern Michigan.

Now to the matrix.  These are for various locations across the Midwest.

CITY
12z NAM
12z GFS
12z RPM
12z EURO
AVG
Cedar Rapids, IA
8.2”
10.3”


9.3”
Columbus, IN


0.3”

0.3”
Bloomington, IN
2.2”

1.3”

1.8”
Indianapolis
1.4”
0.6”
0.7”

0.9”
Lafayette, IN
1.4”
0.9”
0.2”

0.8”
Moline, IL
3.8”
2.3”


3.1”
Muncie, IN
1.7”
1.5”
0.8”

1.3”
St. Louis
0.0”
0.1”
0.1”

0.1”

I will continue to update the matrix as more model data comes in.  This way, you can see what the various models are indicating.

Wednesday, December 12, 2012

4:30pm Weather Update

The morning run of both NOAA’s global forecast model (GFS) and the European agency’s (ECMWF) is in.  Both continue to indicate an area of low pressure developing early next week in the mid-Mississippi Valley.

We start our journey with the ECMWF (the Euro).  Generally, this is my preferred computer model for forecasting, especially beyond 48 hours.  The Euro develops an area of low pressure  initially over Oklahoma and Texas Monday afternoon.  The low then moves east.  Below is look at the Euro’s projection of Mean Surface Level Pressure and precipitation at 6am CT Tuesday, December 18.

(Click the image to see a larger version.)

You can see the area of low pressure centered over NW Mississippi.  That is a perfect location for measurable snow in parts of southeast Missouri, western Kentucky and extreme southern Illinois.  The big thing to note, look at the lack of moisture.  The storm doesn’t draw up a lot of moisture.

I also want you to note the grey and blue area in SW Missouri.  This is likely generated by the upper-level low coming in on the NW side of the storm.  Upper-level lows can and often do produce snow.  Usually it isn’t the BIG amounts of snow you see in snow storms, but more of a drier/fluffier snow.

The next image is from 12pm CT Tuesday.

(Click the image to see a larger version.)

The upper-level low is located over SW Missouri/NW Arkansas.  Notice the moisture the model tries to develop on the NW side of the surface low over the “Heartland”.

Just a quick view of the model would suggest 1”-3” of snow in parts of southeast Missouri, extreme southern Illinois, western Kentucky and northwest Tennessee.

The GFS on the other hand is a little quicker with moving the storm through the Midwest.  It is also much drier.  Below is the GFS for 12pm CT Monday.

(Click the image to see a larger version.)

Note it has the area of low pressure over NW Alabama and SW Tennessee.  The location is good but look on the north/northwest side of the storm.  It is dry.  Also notice that we are talking about the storms location 24-36 hours earlier than the Euro.

Here is the GFS for 6pm CT Monday.

(Click the image to see a larger version.)

It is quickly moving east to the coast.  In fact, beyond 6pm CT Monday, it develops are large storm for the east coast.

At this point it is entirely too early to be talking about specific snowfall amounts.  Heck, at this point it is too early to know if this storm will develop for sure.  As I mentioned in my earlier post from today, I want to see the models continue to show the storm on Thursday and Friday’s runs before I get too excited.  I am keeping my “Freak-Out-Meter” at 0.5 out of 10.

Sunday, July 3, 2011

Severe Thunderstorm Watch #588

The Storm Prediction Center has issued Severe Thunderstorm Watch #588 for eastern Missouri and south central Illinois. The watch is in effect until 8:00pm CT Sunday.


A few of the communities included in the watch include: Missouri: Chesterfield, Columbua, Farmington, O'Fallon, St. Louis, Ste. Genevieve; Illinois: Belleville, Centralia, Du Quoin, Edwardsville, Effingham, Flora and Mt. Vernon.

Thunderstorms are beginning to flare up in the watch area along a weak front. Heating of the day is allowing the atmosphere to become unstable. Combine the instability and a lifting mechanism (the front) and you can get several strong thunderstorms.


The main severe weather threat will be hail. The storms will also be capable of producing heavy downpours. A few of the thunderstorms could produce some strong winds as storms collapse.

The thunderstorms are expected to move east at 25-30 mph.

Remember that you can check out the radar and the latest warnings by using the tabs at the top of my page.